
Page 15 - Labour Market Information Bulletin - 2020 Volume 01
P. 15
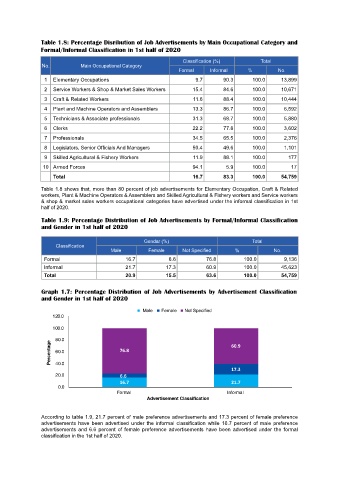
Table 1.8: Percentage Disribution of Job Advertisements by Main Occupational Category and
               Formal/Informal Classification in 1st half of 2020

                                                                 Classification (%)          Total
                No.          Main Occupational Category
                                                                Formal     Informal     %          No.
                 1  Elementary Occupations                            9.7      90.3       100.0     13,899
                 2  Service Workers & Shop & Market Sales Workers    15.4      84.6       100.0     10,671
                 3  Craft & Related Workers                          11.6      88.4       100.0     10,444
                 4  Plant and Machine Operators and Assemblers       13.3      86.7       100.0      6,592
                 5  Technicians & Associate professionals            31.3      68.7       100.0      5,880
                 6  Clerks                                           22.2      77.8       100.0      3,602

                 7  Professionals                                    34.5      65.5       100.0      2,376
                 8  Legislators, Senior Officials And Managers       50.4      49.6       100.0      1,101
                 9  Skilled Agricultural & Fishery Workers           11.9      88.1       100.0        177
                10 Armed Forces                                      94.1       5.9       100.0         17
                    Total                                            16.7      83.3       100.0     54,759

               Table 1.8 shows that, more than 80 percent of job advertisements for Elementary Occupation, Craft & Related
               workers, Plant & Machine Operators & Assemblers and Skilled Agricultural & Fishery workers and Service workers
               & shop & market sales workers occupational categories have advertised under the informal classification in 1st
               half of 2020.

                Table 1.9: Percentage Distribution of Job Advertisements by Formal/Informal Classification
                and Gender in 1st half of 2020

                                                    Gendar (%)                            Total
                     Classification
                                        Male         Female      Not Specified      %            No.
                 Formal                      16.7           6.6          76.8          100.0         9,136
                 Informal                    21.7          17.3          60.9          100.0        45,623
                 Total                       20.9          15.5          63.6          100.0        54,759

                Graph 1.7: Percentage Distribution of Job Advertisements by Advertisement Classification
                and Gender in 1st half of 2020


                According to table 1.9, 21.7 percent of male preference advertisements and 17.3 percent of female preference
                advertisements  have  been  advertised  under  the  informal  classification  while  16.7  percent  of  male  preference
                advertisements and 6.6 percent  of female preference advertisements have been advertised under the formal
                classification in the 1st half of 2020.