Page 13 - Labour Market Information Bulletin - 2020 Volume 01
P. 13

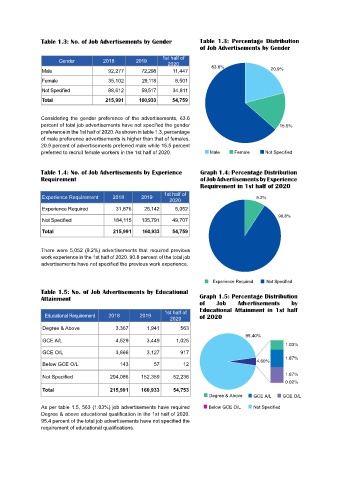
Table 1.3: No. of Job Advertisements by Gender          Table 1.3:  Percentage  Distribution
                                                                       of Job Advertisements by Gender
                                                          1st half of
                      Gender         2018        2019
                                                            2020
                                                                           63.6%
                Male                    92,277     72,298     11,447                            20.9%
                Female                  35,102     29,118      8,501
                Not Specified           88,612     59,517     34,811
                Total                  215,991    160,933     54,759


               Considering  the gender  preference of the advertisements,  63.6
               percent of total job advertisements have not specified the gender                   15.5%
               preference in the 1st half of 2020. As shown in table 1.3, percentage
               of male preference advertisements is higher than that of females.
               20.9 percent of advertisements preferred male while 15.5 percent
               preferred to recruit female workers in the 1st half of 2020.  Male   Female    Not Specified


               Table 1.4: No. of Job Advertisements by Experience      Graph 1.4: Percentage Distribution
               Requirement                                             of Job Advertisements by Experience
                                                                       Requirement in 1st half of 2020
                                                           1st half of
                Experience Requirement   2018      2019                                    9.2%
                                                             2020
                Experience Required       31,876    25,142     5,052
                                                                                                   90.8%
                Not Specified            184,115    135,791    49,707
                Total                    215,991    160,933    54,759


               There were 5,052 (9.2%) advertisements that required previous
               work experience in the 1st half of 2020. 90.8 percent of the total job
               advertisements have not specified the previous work experience.


                                                                            Experience Required   Not Specified
               Table 1.5: No. of Job Advertisements by Educational
               Attainment                                              Graph 1.5: Percentage Distribution
                                                                       of    Job     Advertisements    by
                                                           1st half of   Educational Attainment in 1st half
                 Educational Requirement  2018    2019                 of 2020
                                                             2020
                Degree & Above            3,367      1,941       563
                                                                                       95.40%
                GCE A/L                   4,529      3,449     1,025
                                                                                                     1.03%
                GCE O/L                   3,866      3,127       917
                                                                                                     1.87%
                Below GCE O/L               143         57        12                       4.60%

                Not Specified           204,086    152,359    52,236                                 1.67%
                                                                                                     0.02%
                Total                   215,991    160,933    54,753
                                                                          Degree & Above   GCE A/L   GCE O/L
               As per table 1.5, 563 (1.03%) job advertisements have required   Below GCE O/L   Not Specified
               Degree & above educational qualification in the 1st half of 2020.
               95.4 percent of the total job advertisements have not specified the
               requirement of educational qualifications.
   8   9   10   11   12   13   14   15   16   17   18