
Page 14 - Labour Market Information Bulletin - 2020 Volume 01
P. 14
SECTION 1 | DEMAND FOR LABOUR
Labour Market Information Bulletin - Volume 1/2020
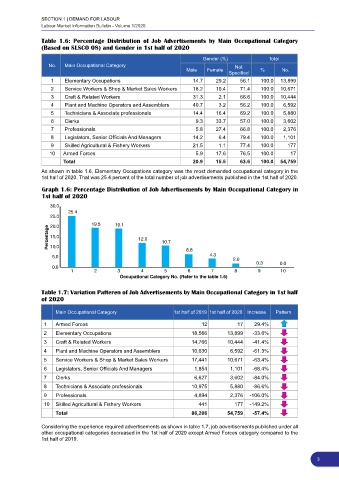
Table 1.6: Percentage Distribution of Job Advertisements by Main Occupational Category
(Based on SLSCO 08) and Gender in 1st half of 2020
Gender (%) Total
No. Main Occupational Category Not
Male Female % No.
Specified
1 Elementary Occupations 14.7 29.2 56.1 100.0 13,899
2 Service Workers & Shop & Market Sales Workers 18.2 10.4 71.4 100.0 10,671
3 Craft & Related Workers 31.3 2.1 66.6 100.0 10,444
4 Plant and Machine Operators and Assemblers 40.7 3.2 56.2 100.0 6,592
5 Technicians & Associate professionals 14.4 16.4 69.2 100.0 5,880
6 Clerks 9.3 33.7 57.0 100.0 3,602
7 Professionals 5.8 27.4 66.8 100.0 2,376
8 Legislators, Senior Officials And Managers 14.2 6.4 79.4 100.0 1,101
9 Skilled Agricultural & Fishery Workers 21.5 1.1 77.4 100.0 177
10 Armed Forces 5.9 17.6 76.5 100.0 17
Total 20.9 15.5 63.6 100.0 54,759
As shown in table 1.6, Elementary Occupations category was the most demanded occupational category in the
1st half of 2020. That was 25.4 percent of the total number of job advertisements published in the 1st half of 2020.
Graph 1.6: Percentage Distribution of Job Advertisements by Main Occupational Category in
1st half of 2020
Table 1.7: Variation Patteren of Job Advertisements by Main Occupational Category in 1st half
of 2020
Main Occupational Category 1st half of 2019 1st half of 2020 Increase Pattern
1 Armed Forces 12 17 29.4%
2 Elementary Occupations 18,566 13,899 -33.6%
3 Craft & Related Workers 14,766 10,444 -41.4%
4 Plant and Machine Operators and Assemblers 10,630 6,592 -61.3%
5 Service Workers & Shop & Market Sales Workers 17,441 10,671 -63.4%
6 Legislators, Senior Officials And Managers 1,854 1,101 -68.4%
7 Clerks 6,627 3,602 -84.0%
8 Technicians & Associate professionals 10,975 5,880 -86.6%
9 Professionals 4,894 2,376 -106.0%
10 Skilled Agricultural & Fishery Workers 441 177 -149.2%
Total 86,206 54,759 -57.4%
Considering the experience required advertisements as shown in table 1.7, job advertisements published under all
other occupational categories decreased in the 1st half of 2020 except Armed Forces category compared to the
1st half of 2019.
3